Zilker Market Report, September 2026: Faster Sales, Smaller Discounts, and Tighter Inventory
Welcome to our monthly Zilker market report!

Zilker is one of the most sought-after neighborhoods in Austin for clients relocating from Los Angeles to Austin, San Francisco to Austin, Denver to Austin, and Seattle to Austin. Being minutes from Zilker Park, Barton Springs Pool, and the Lady Bird Lake trail, with easy access to downtown and the shops and restaurants along South Lamar and South First, gives Zilker residents an outdoor, active lifestyle that is hard to match anywhere in the city. For transplants who want to swim, paddle, run, and walk to dinner without giving up a central location, Zilker is consistently at the top of the list of the best neighborhoods in Austin.


In these reports, we focus on single-family home inventory in the Zilker neighborhood, since condominiums tend to beat to their own drum, and Austin condominium inventory is currently extremely high. Focusing on homes in Zilker lets us get a true feel for the Zilker real estate market. Unless noted otherwise, the indicators compare the last 12 months (October 2025 through September 2026) with the 12 months before that, which smooths out the month-to-month noise you get in a smaller neighborhood.

There are currently 28 active single-family properties in the Zilker area. Five went under contract in the last month, and five closed in the last month on the MLS. Only three new listings came to market in September (versus ten last September), nine sellers reduced their price, and two listings were withdrawn. Zilker currently sits at 3.75 months of inventory, and over the last 12 months it averaged 3.81 months, down from 5.87 a year earlier -- which has the neighborhood leaning toward seller's market territory, since a balanced market is 4-6 months of inventory.

The headline this month is efficiency.
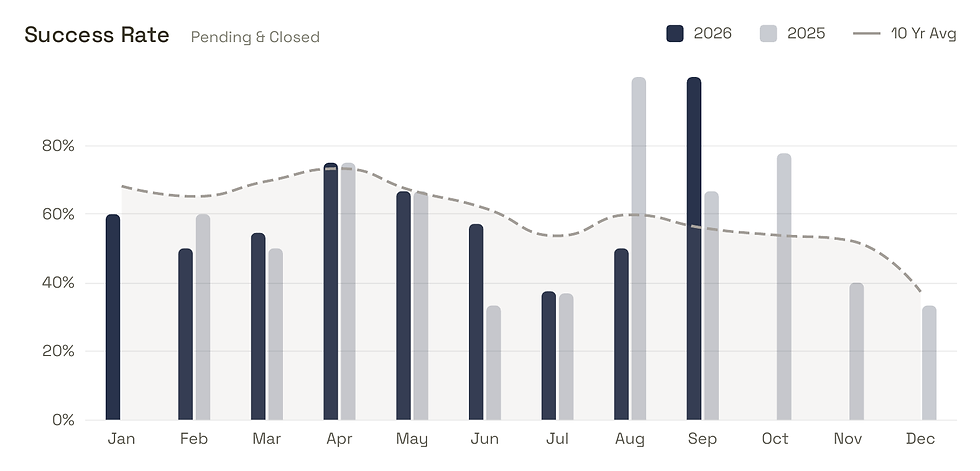
Zilker homes are selling faster and with less negotiation than they were a year ago. Median days on market fell to 34.8 over the last 12 months from 49.3 the year before, and average days on market dropped to 66.4 from 78.9. The success rate, which measures the share of listings that go pending or close rather than expire or withdraw, improved to 65.0% from 58.9%. Total sales held steady at 66 versus 64, while new listings fell 13.5% to 96 from 111, and active listings dropped to 123 from 139.

Sellers are also giving up less at the closing table. Homes closed about 3.32% below asking over the last 12 months, compared with 6.94% below asking the year before, and the average trim from original list price to final asking price narrowed to 3.14% from 4.39%. In plain English: well-priced Zilker homes are attracting buyers quickly, and buyers are paying closer to the number on the sign.

Now, a word on prices, because the median can mislead. The median sales price came in at $1,452,334 over the last 12 months versus $1,520,333 the year before, and the average sales price at $1,579,621 versus $1,658,977. Read at face value, that looks like a roughly 4.5% drop. It is a mixed metric. The median reflects which homes happened to sell, and a few more smaller or older homes trading can pull it down without any individual home losing value. The more reliable measure, price per square foot, tells the real story: the median came in at $667 versus $671 a year ago, essentially flat. Zilker values are holding steady.

Keep in mind that the data in this report only shows the properties that trade on the MLS. A meaningful share of Zilker homes change hands off-market, which is why our recommendation for potential home buyers seeking the best real estate agent in Austin is simple: make sure your realtor is plugged into off-market inventory. If an agent does fewer than 10 transactions a year, it is not likely that they know who to call or where to look to find that off-market inventory. And no, it is not rude to ask them how many transactions they do annually.
Over the long run, location keeps doing the heavy lifting in Zilker. The appreciation chart below shows the median sales price roughly doubling since 2016, with a big 31.83% jump in 2020 and essentially flat years since 2023 (-1.98% in 2023, +4.16% in 2024, and -0.34% in 2025). Lot size, proximity to the park and the greenbelt, and how much home can be built on a lot all factor into land value here.

Heading into fall
With only three new listings in September and inventory well below where it was a year ago, buyers looking in Zilker this fall should be ready to move when the right home comes up. Sellers who price to today's market are being rewarded with faster sales and smaller discounts.
See you next month with more analysis!
Frequently asked questions
Is Zilker a buyer's or seller's market right now?
Zilker currently sits at 3.75 months of single-family inventory, and it averaged 3.81 months over the last 12 months, down from 5.87 the year before. Under four months typically favors sellers, since a balanced market is 4-6 months of inventory, so Zilker leans seller-friendly heading into fall.
Did Zilker home prices drop in 2026?
Not in a meaningful way. The median sales price over the last 12 months was $1,452,334 versus $1,520,333 the year before, but that reflects the mix of homes that sold. Median price per square foot, the more reliable measure, was $667 versus $671, essentially flat.
How fast are homes selling in Zilker?
Faster than a year ago. Median days on market fell to 34.8 over the last 12 months from 49.3, and homes closed about 3.32% below asking versus 6.94% the year before. The success rate improved to 65.0% from 58.9%.
How many homes sold in Zilker over the last year?
66 single-family homes closed on the MLS from October 2025 through September 2026, versus 64 the year before, for total sales volume of $104,254,971. In September 2026, five homes closed and five went pending.
Why is Zilker popular with people relocating to Austin?
Lifestyle. Zilker Park, Barton Springs Pool, and the Lady Bird Lake trail are right in the neighborhood's backyard, and downtown, South Lamar, and South First are minutes away. Buyers relocating from Los Angeles, San Francisco, Denver, and Seattle love being able to get outside every day without giving up a central location.
What is the best metric to value a Zilker home?
Price per square foot and recent comparable sales, adjusted for condition, are far more reliable than median sale price, which swings based on the mix of homes that happen to sell. That being said - it's important to account for land value and not just rely on price per square foot - see a Reel we made about that here.
Our goal as your trusted real estate advisors is to provide you with the information you need to help you reach your investment goals.
As always, real estate is hyperlocal and extremely situational, so please reach out to us to discuss your specific situation. We’d love to help you and strategize what’s in your best interest.
Cheers!

© 2026 Berbas Group. All rights reserved.