September '26 Stats: Steady Prices, Softer Demand
We hope you’re enjoying the first real hints of fall (and that the cooler mornings are treating you well). Every month we sit down with the latest numbers to figure out what they mean for you, and September gave us plenty to talk about. The short version is that prices have held steady (average sold price rose 4.4% on a year-over-year basis), but a sharp climb in mortgage rates has buyers thinking twice, and that’s changing the feel of the market heading into the holidays.

Key Highlights:
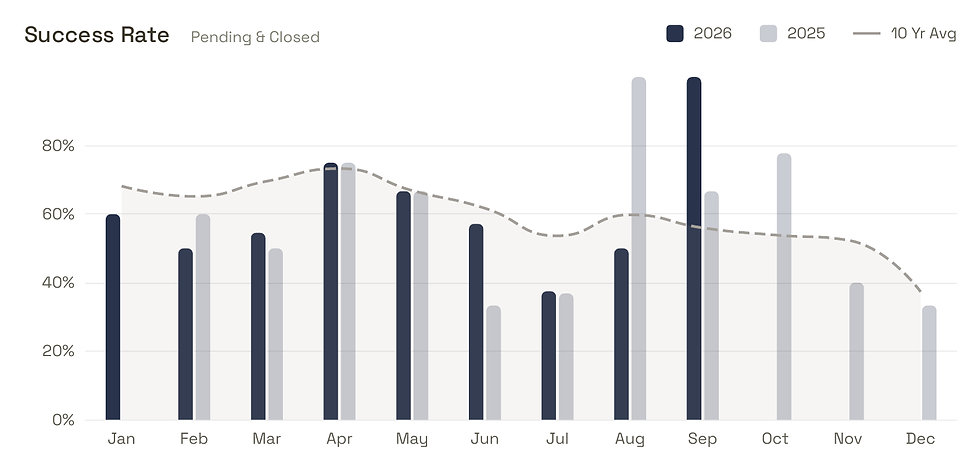
Pending units declined 5.9% year-over-year to 2,222, the first month in 2026 that contracts trailed 2025, and fell 14.4% from August, more than double the August to September dip we saw last year.
Year-over-year Average Sold Price increased 4.4% to $567,222 and Median Sold Price was flat (+0.1%) at $415,360. Price per square foot slipped to $245 average and $207 median.
Total Sales declined 6.5% year-over-year to 2,449 units and volume sold fell 2.4% to $1.39 billion, though year-to-date volume is still up 5.2% at $13.76 billion.
New listings increased 7.9% year-over-year to 3,785 while Withdrawn/Expired Listings were exactly flat at 1,819, so more sellers came on and the same number walked away.
Months of Inventory (MOI) came in at 5.3, down from 5.5 a year ago but up from 4.9 in August, and Median Sold to List Price improved to 98.1% (from 97.7%).

Prices Stabilize
After two consecutive months of month-over-month declines, prices found a floor in September. As you can see in the chart below, Avg Sold Price edged up 0.5% from August to $567,222 and Median Sold Price edged up 0.3% to $415,360. Both remain well below the June peak (roughly $615,000 average and $450,000 median), and the median is still sitting just under its flat 12 month trend line.
The year-over-year numbers need context. Average price rose 4.4% while price per square foot declined 0.8% (and median price per square foot declined 1.9%), which tells us September's buyers purchased larger homes, not that homes gained value. The median, up 0.1%, is the honest read: Austin prices have been flat for a full year. Flat is not exciting, but it is stable. And stability is what buyers and sellers both need to make decisions.

Demand Takes the Hit
Pending units ran well ahead of 2025 for the first five months of the year, converged with 2025 from June through August, and dropped below 2025 in September for the first time this year. Some of that is normal seasonality, but last year Pending units fell roughly 6% from August to September and this year they fell 14.4%. That gap is rates. Pending units are a leading indicator, so expect October and November closings to come in below last year.
Dollar volume is starting to reflect it. September volume sold was $1.39 billion, down 2.42% year-over-year, and the year-to-date gain narrowed to 5.22% from 6.16% last month. The strong spring still gives us a cushion, but it is getting a little thinner every month.


Sellers Show Up as Buyers Step Back
Last month we said a wave of new inventory was not coming, and September did not fully cooperate. New listings came in at 3,785, up 7.9% year-over-year, and as you can see in the chart below, the 2026 curve rose from August while the 2025 curve fell over the same stretch. Withdrawn/Expired Listings were exactly flat at 1,819, so the seller patience we saw in August did not carry into September.
More listings and fewer contracts pushed the month-of-inventory from 4.9 in August to 5.3. That is still a balanced market, still below last September's 5.5, and still below the 6 month mark that typically signals a buyer's market. Average days on market rose to 86 from 77 in August (though it improved from 89 a year ago), and that number will keep climbing through the holidays.

Rates Hit Their Highest Level Since 2023
The bad news is rates…again. As you can see in the chart below, mortgage rates climbed throughout September and into October. Freddie Mac's 30-year fixed averaged 7.40% on October 8th, its seventh consecutive weekly increase and the highest reading since late 2023, up from 6.34% a year ago. The Fed raised the federal funds rate by a quarter point at its September meeting to a range of 3.75% to 4.00%, and the 10 year Treasury yield pushed above 5% late in the month as elevated oil prices, geopolitical tension, the federal deficit, and heavy AI investment all competed for the same capital.
For a buyer putting 20% down on Austin's median priced home, the principal and interest payment at 7.40% is about $2,301 a month. A year ago it was about $2,065, and at February's low of 5.90% it was about $1,971. That is a $330 per month swing in eight months on the exact same house, which explains why pending units fell the way they did. Last month we said not to plan around rate relief this year, and that advice holds even more firmly now.

If you're a buyer
City-wide, buyer competition dropped sharply in September, and sellers who listed into a slowing market are about to feel it. That gives you negotiating power, even at 7.4%. The sold-to-list ratio at 98.1% says the typical discount on a well-priced home is under 2%. So the real room is on homes that have been sitting 60+ days and on concessions. Ask for a seller-paid rate buy-down before you ask for a price cut, since it usually does more for your monthly payment. Buy based on the payment you can afford today and treat a future refinance as a bonus, not the plan.
However, in some central city neighborhoods, rare homes still command a premium, and they rarely make it to market.
If you're a seller
September was the month the market shifted from steady to slow. More listings are competing for fewer buyers, days on market are rising, and the holidays are coming. If you need to sell in 2026, make sure you stand out as the best value to buyers. Consider offering a rate buydown when negotiations start, which buyers value more than an equivalent price cut when rates are above 7%. Offer this and show the monthly savings in case the buyer’s agent doesn’t think of it. Reducing in small steps through November is the most expensive way to sell. If you can wait, spring 2027 will bring more buyers back, but at current rates, plan for similar prices, not higher ones.
Our goal as your trusted real estate advisors is to provide you with the information you need to help you reach your investment goals.
As always, real estate is hyperlocal and extremely situational, so please reach out to us to discuss your specific situation. We’d love to help you and strategize what’s in your best interest.
Cheers!

© 2026 Berbas Group. All rights reserved.