September 2026 Austin Market Stats: Sales Up, Prices Flat, and a Balanced Market Heading Into Fall
Welcome back to our monthly Austin market report!

This report covers single-family homes across the five-county Austin metro: Travis, Williamson, Hays, Bastrop, and Caldwell counties. Austin continues to be a top destination for clients relocating from Los Angeles to Austin, San Francisco to Austin, New York to Austin, Seattle to Austin, and Chicago to Austin, and the metro-wide numbers are the backdrop for every neighborhood report we publish. Unless noted otherwise, the indicators compare the last 12 months (October 2025 through September 2026) with the 12 months before that, which smooths out the month-to-month noise you get in a smaller neighborhood.


Key highlights
Months of inventory held at 4.66 over the last 12 months, versus 4.64 a year earlier: firmly balanced
Total sales rose 2.7% to 28,016, and pending listings rose 5.2% to 28,590
Total sales volume reached $16,407,198,921, up 3.5%
The median sales price slipped 1.8% to $438,617, while the average rose 0.8% to $585,637
Median days on market came in at 55.1, versus 52.6, and homes closed about 2.64% below asking

In September 2026, there were 15,068 active single-family listings across the metro. 2,049 went under contract, 1,811 closed on the MLS, and 3,289 new listings came to market. 5,054 sellers reduced their price, 779 listings were withdrawn, and 445 expired. The metro currently sits at 5.11 months of inventory -- right in the middle of balanced territory, since a balanced market is 4-6 months of inventory.

Demand held up better than prices.
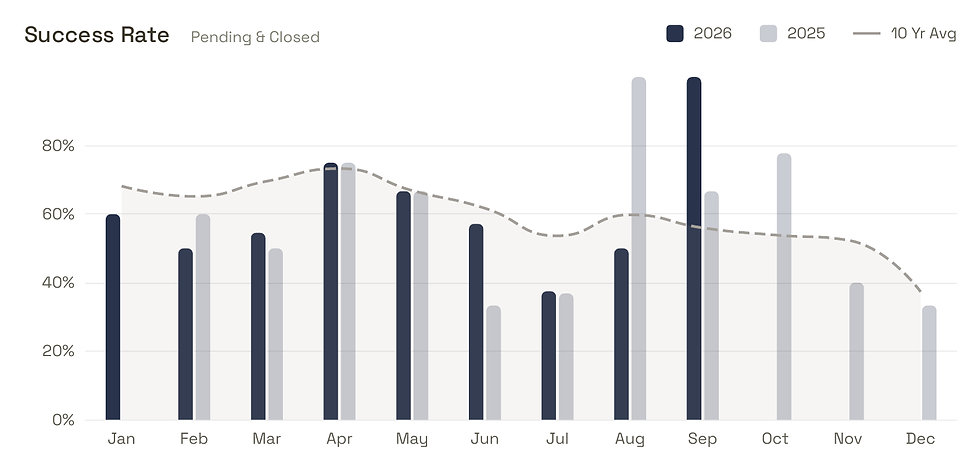
Buyers kept showing up over the last year. Pending listings rose 5.2% to 28,590 from 27,184, and total sales rose 2.7% to 28,016 from 27,290. The success rate, which measures the share of listings that go pending or close rather than expire or withdraw, improved to 68.5% from 66.5%. New listings rose a modest 1.3% to 42,848, and expired listings fell to 5,370 from 5,622, so more sellers are getting deals done rather than giving up.

Sellers are still having to work for it, though. Roughly one in three active listings (5,054 of 15,068) took a price reduction in September. Over the last 12 months, sellers trimmed an average of 4.5% from original list price to final asking price, slightly more than the 4.21% a year earlier, and homes closed about 2.64% below asking. Median days on market rose to 55.1 from 52.6, and average days on market rose to 87.1 from 82.2.

Now, a word on prices. The median sales price came in at $438,617 over the last 12 months versus $446,805 the year before, down 1.8%, while the average sales price rose 0.8% to $585,637. Median price per square foot slipped 3.7% to $208 from $216, and the average to $246 from $251. Unlike our smaller neighborhood reports, the metro has enough sales that these numbers are not just noise: Austin prices are flat to slightly softer, and have been for a few years.

The appreciation chart below puts that in context. After a 33.41% surge in 2021 and another 10.56% in 2022, the metro median sales price fell 10.83% in 2023, 2.20% in 2024, and 1.09% in 2025. Austin's market has worked through most of its post-pandemic correction, and what we are seeing now is a flat, balanced market rather than a falling one.

If you're a buyer
This is a good market to buy in. Inventory is balanced at around five months, sellers are reducing prices, and homes are closing below asking on average. Get pre-approved, know the monthly payment you are comfortable with, and target homes that have been sitting for a while, where you will have the most negotiating leverage.
If you're a seller
The market rewards homes priced to recent comparable sales and punishes homes priced to 2022. With roughly one in three listings taking a price cut, pricing correctly on day one and presenting the home well is the best way to sell quickly and for top dollar. As we head into the slower fall and holiday season, sellers who need to close in 2026 should price to today's market now.
See you next month with more analysis!
Frequently asked questions
Is Austin a buyer's or seller's market right now?
Austin is balanced. The five-county metro averaged 4.66 months of single-family inventory over the last 12 months, versus 4.64 a year earlier, and currently sits at 5.11 months. A balanced market is 4-6 months of inventory.
Are Austin home prices still dropping?
Prices are flat to slightly softer. The metro median sales price over the last 12 months was $438,617, down 1.8%, while the average rose 0.8% to $585,637. After double-digit gains in 2021 and 2022 and a correction in 2023, the market has largely leveled off.
How fast are homes selling in Austin?
A little slower than a year ago. Median days on market came in at 55.1 over the last 12 months versus 52.6, and homes closed about 2.64% below asking.
How many homes sold in the Austin metro over the last year?
28,016 single-family homes closed on the MLS from October 2025 through September 2026, up 2.7% from 27,290, for total sales volume of $16,407,198,921. In September 2026, 1,811 homes closed and 2,049 went pending.
Which counties does this Austin market report cover?
Travis, Williamson, Hays, Bastrop, and Caldwell counties, single-family residential homes only. For neighborhood-level detail, see our monthly reports on Hyde Park, North Loop, Hancock/NUNA, Zilker, Barton Hills, Tarrytown, and Rollingwood.
Our goal as your trusted real estate advisors is to provide you with the information you need to help you reach your investment goals.
As always, real estate is hyperlocal and extremely situational, so please reach out to us to discuss your specific situation. We’d love to help you and strategize what’s in your best interest.
Cheers!

© 2026 Berbas Group. All rights reserved.